

How a US-Iran deal could influence the economy and financial markets
- 06.18.26
- Markets & Investing
- Commentary
Review the latest Weekly Headings by CIO Larry Adam.
Key takeaways:
- Lower oil prices will bring timely relief for consumers as summer travel begins
- The Fed’s hawkish tilt suggests it’s focused on more than just elevated energy prices
- Lower oil prices point to a peak in energy-driven inflation
The US-Iran conflict – and its impact on oil prices – has dominated headlines over the past three months. Higher oil prices have pushed inflation to a three‑year high, reshaping the Federal Reserve’s rate outlook. While policymakers typically look through temporary, geopolitically driven shocks, this episode comes at a challenging time. Repeated supply disruptions have kept inflation above the Fed’s 2.0% target for more than five years, drawing the attention of new Fed Chair Warsh. Below, we outline how a US‑Iran deal – and a potential decline in oil prices – could influence the US economy, the rate outlook and financial markets in the months ahead.
Oil prices will continue to cool down, but it may take time
West Texas Intermediate (WTI) crude has fallen sharply from April’s peak near $113 per barrel to below $80 this week, a nearly 30% drop that signals a meaningful unwind of geopolitical risk. Markets are beginning to anticipate a reopening of the Strait of Hormuz and are taking comfort that the region’s oil infrastructure has emerged largely intact. But the harder phase now begins: restoring supply.
Three key hurdles must be cleared before Persian Gulf exports – currently around six million barrels per day – can move back toward pre‑war levels that were three times higher at ~20 million barrels per day. First, Iranian naval mines need to be removed. Second, shipping crews must return. And third, shuttered oilfields need to restart production. Our base case is that full normalization may not occur until late July at the earliest. As supply gradually recovers and global inventories begin to stabilize, that should put additional downward pressure on prices, potentially driving WTI toward our year‑end target of ~$70 per barrel.
Falling oil prices will provide consumer relief
Despite higher gasoline prices and broader inflation pressures, the US consumer has remained remarkably robust this year. Retail sales rose at their fastest pace since January 2023 in May, while real‑time activity metrics, such as restaurant bookings and department store spending, have steadily moved higher versus last year. That said, early cracks are beginning to emerge.
With inflation still elevated and the boost from large tax refunds fading, sentiment has fallen to a record low, real wage growth has turned negative for two consecutive months, and the personal savings rate has dropped to its lowest level since 2022. Lower gasoline prices should provide timely relief – particularly for lower‑income consumers – as the summer travel season begins. With consumption driving ~70% of GDP, a still‑resilient consumer should continue to support economic growth and underpin our positive view on the consumer discretionary sector.
Fed delivers rate outlook
New Fed Chair Kevin Warsh put his stamp on his first Federal Open Market Committee (FOMC) meeting, sharply slimming the statement to just 130 words, offering no forward guidance, and delivering a more hawkish than expected message focused squarely on inflation. While Warsh announced the creation of five task forces – including one focused on the Fed’s inflation framework – he emphasized that the current 2% target is unlikely to change.
In addition, the median 2026 dot shifted to 3.8%, signaling a rate hike by year‑end versus the cut expected in March. Nine members now project at least one hike this year, up from none previously. In a break from tradition, the chair did not submit a forecast. This hawkish pivot suggests policymakers are focused on more than just elevated energy prices. It reflects a strong labor market and resilient growth, supported in part by fiscal tailwinds and a global AI‑driven capex cycle. Lower oil prices should ease inflation pressures on the margin, giving the Fed breathing room as it assesses whether disinflation resumes – whether from falling energy prices or AI‑driven productivity gains – in the months ahead. That makes upcoming inflation prints more important than ever.
Lower oil prices will keep a lid on yields
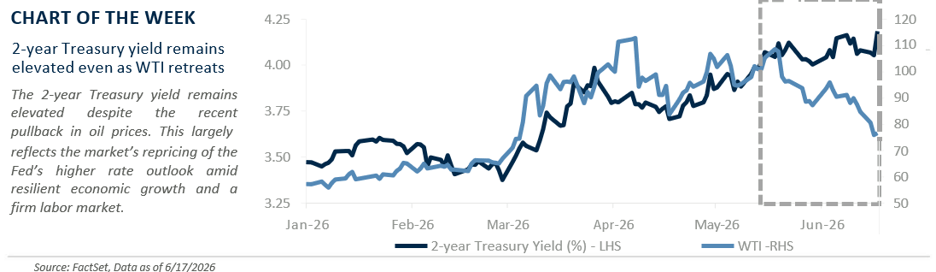
Treasury yields moved sharply higher following the onset of the US‑Iran conflict, largely tracking the surge in oil prices and the repricing of the Fed’s higher rate outlook. Since then, the pullback in oil has led to only a modest retracement in rates, with the 10‑year still hovering near a one‑month low around 4.46% after peaking at 4.67% on May 19.
Yields also reacted sharply to the Fed’s hawkish dot plot, with the policy‑sensitive 2‑year jumping more than 15 basis points, its largest Fed‑day move since March 2008. While lower oil prices point to a peak in energy‑driven inflation, the bond market will need clearer evidence of broader disinflation before yields can move meaningfully lower, especially given healthy growth and a firm labor market. For now, that keeps rates anchored at elevated levels. But with the new Fed chair re‑establishing inflation‑fighting credibility, we see limited upside for yields. That’s constructive for equities, as the S&P 500 has historically faced resistance when the 10‑year yield pushes into the 4.50% to 4.75% range.
*MAGMAN represents a composite of Microsoft, Apple, Google, Meta, Amazon, Nvidia.
All expressions of opinion reflect the judgment of the author(s) and the Investment Strategy Committee and are subject to change. This information should not be construed as a recommendation. The foregoing content is subject to change at any time without notice. Content provided herein is for informational purposes only. There is no guarantee that these statements, opinions or forecasts provided herein will prove to be correct. Past performance is not a guarantee of future results. Indices and peer groups are not available for direct investment. Any investor who attempts to mimic the performance of an index or peer group would incur fees and expenses that would reduce returns. No investment strategy can guarantee success.
Economic and market conditions are subject to change. Investing involves risks including the possible loss of capital.
The information has been obtained from sources considered to be reliable, but we do not guarantee that the foregoing material is accurate or complete. Diversification and asset allocation do not ensure a profit or protect against a loss.
The S&P 500 Total Return Index: The index is widely regarded as the best single gauge of large-cap U.S. equities. There is over USD 7.8 trillion benchmarked to the index, with index assets comprising approximately USD 2.2 trillion of this total. The index includes 500 leading companies and captures approximately 80% coverage of available market capitalization.
Sector investments are companies focused on a specific economic sector and are presented here for illustrative purposes only. Sectors, including technology, are subject to varying levels of competition, economic sensitivity, and political and regulatory risks. Investing in any individual sector involves limited diversification.